

The Thanksgiving Index: Mapping Two Decades of American Inflation
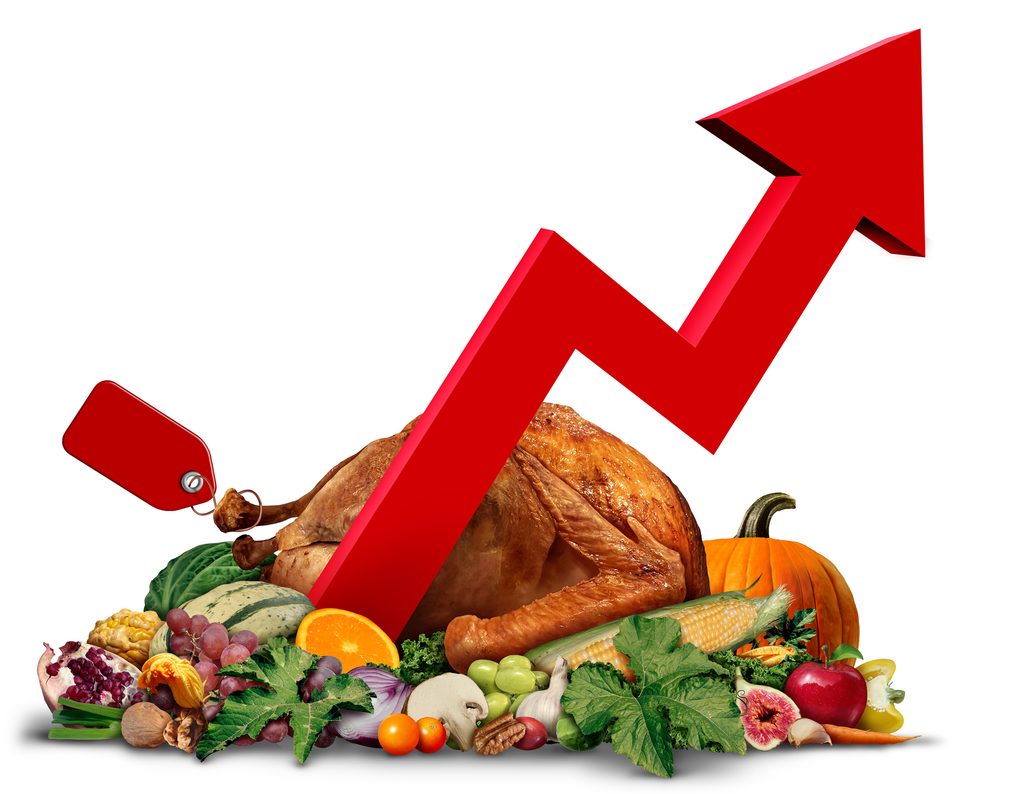
The grocery store aisle in November offers a surprisingly precise lens into the broader American economy. Because the traditional Thanksgiving menu remains largely static across generations, it serves as a highly reliable gauge of household inflation. By tracking the cost of feeding ten people a standard feast—turkey, stuffing, sweet potatoes, rolls, and pumpkin pie—we gain a direct measurement of how the dollar’s purchasing power has eroded or stabilized over time.
Two decades ago, in 2006, the American Farm Bureau Federation—which has monitored this specific holiday market basket since 1986—calculated that a classic dinner for ten cost a mere $38.10. At that time, a 16-pound turkey averaged around $19, consuming roughly half the total budget. The remaining side dishes and desserts required only a fraction of the cost. In this era, food production was highly optimized, and grocery chains routinely utilized staples, including the turkeys themselves, as loss leaders to drive seasonal foot traffic.
Advancing to 2016, the cost of that exact same meal had steadily climbed to roughly $50. While this represented a noticeable nominal increase over a decade, it was the result of a gradual, predictable inflationary curve. When adjusted for the wage growth of that era, the actual “time cost”—the number of hours an average employee needed to work to afford the meal—had actually decreased. Consumers enjoyed a period of relative price stability where holiday budgeting was predictable, aided by aggressive supermarket promotions.
That predictability fractured violently during the economic volatility of the early 2020s. A confluence of global supply chain disruptions, surging agricultural input costs for farmers, and severe avian flu outbreaks dismantled standard pricing models. By 2022, the holiday market basket spiked to a record $64.05, with the turkey alone soaring past $27. For households already navigating tighter budgets, the Thanksgiving table became a stark, tangible representation of the inflation squeezing daily American life.
Today, in 2026, retail grocery prices have retreated from that historic peak but remain entrenched well above their previous baseline. The classic meal now settles around $55. A 16-pound frozen turkey costs approximately $21.50, but notably, the bird’s share of the total grocery bill has dropped to 39%—its lowest proportional cost since the turn of the millennium. This structural shift indicates that recent inflationary pressures have disproportionately driven up the cost of the side dishes, heavily impacting the butter, sweet potatoes, and baked goods that fill out the rest of the table.
While a $55 checkout receipt offers welcome relief compared to the sticker shock of 2022, it still reflects a 45% price increase from twenty years prior. Furthermore, lower retail prices do not inherently signal agricultural prosperity; farmers continue to absorb steep operational costs for diesel, fertilizer, and labor. Ultimately, the Thanksgiving dinner bill connects household kitchen tables directly to macroeconomic reality. While consumer spending data and retail metrics illustrate economic confidence, the cost of turkey and stuffing dictates exactly what inflation feels like on a human level. Over the past twenty years, this single meal has mapped a steady ascent, and a gradual recalibration of American purchasing power.
Stephen Kyne, CFP® is a Partner at Sterling Manor Financial, LLC in Saratoga Springs. Sterling Manor Financial, LLC is an SEC Registered Investment Advisor